
The COVID-19 Recovery Thus Far
Thursday, September 23, 2021 | Bill Handel
Eighteen months after the onset of COVID-19, where are we economically in the United States? And how are things likely to change moving forward?
The COVID-19 recession was by far the shortest in U.S. history, lasting two months, from February to April 2020. The average length of recessions since World War II has been 11 months, and the Great Recession of 2007–2009 was 18 months. However, this recession’s brevity does not imply that it was modest. In fact, the peak unemployment rate was higher than it’s been since the Great Depression in the 1930s.
The overall recovery of the economy has been nothing short of spectacular. Chart 1 below shows U.S. Gross Domestic Product (GDP), the overall level of final economic output. The “V” shape in the chart is an indication of how rapid this recovery has been. Despite the sharpest decline in economic history in the second quarter 2020 – equivalent to an annualized decline in economic activity of 31 percent – we surpassed prepandemic economic output by the second quarter 2021.

What’s clear is the inconsistency in the recovery from the pandemic-induced recession, and this inconsistency could very well continue to plague us into the future. First, the good news.
The Good News
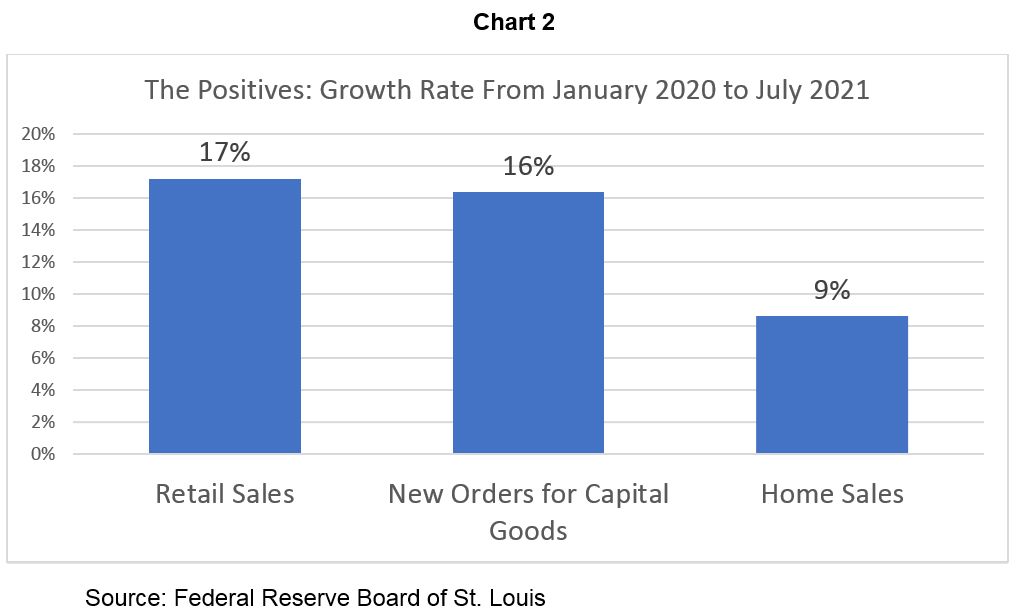
Chart 2 illustrates the change in activity between January 2020, just prior to the onset of COVID-19, and July 2021. Retail spending – what we as consumers are buying in stores or online – continues to be very strong (up 17 percent), as does investment in the productive capacity of businesses (new orders for capital goods), which is up 16 percent. And in what is surely no surprise to anyone, the consumer real estate markets continue to be very strong (up 9 percent).

Why have these areas proven to be so resilient? There are several factors. Government support programs continue to aid consumer spending and keep retail sales at high levels. Retail sales recovered quickly and have continued to move in a generally positive manner for most of the past 15 months.
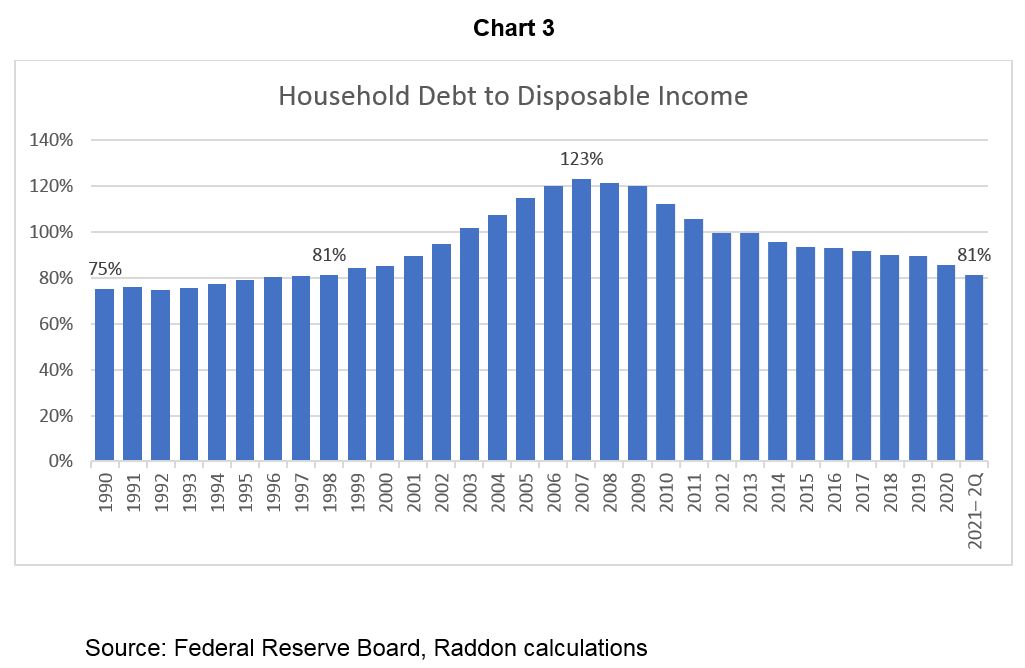
New orders for capital goods, which is a measure of business spending on productive capacity, has also continued to grow at a positive pace in each month since April 2020. A major factor in this continued strength is the underlying strength of our economy and the relatively low debt levels of consumers. Unlike the Great Recession of 2007–2009, the COVID-19 recession was not debt-induced. Our personal debt levels are lower than they’ve been since the 1990s, as Chart 3 below illustrates. Debt-driven recessions are the most difficult to recover from as consumers can only slowly rid themselves of their debt hangover.

The strength in home sales in Chart 2 – up 9 percent since January 2020 – is driven significantly by demography, although government support programs and the lack of large levels of consumer debt have also helped, as have historically low interest rates. The millennial population in the U.S. is now approximately 50 percent larger than their baby boomer parents, and millennials have moved into their prime home-buying years. Real estate markets have the potential to continue a strong trajectory for the foreseeable future.
Even with this positive data on consumer real estate sales, note that in July 2021 real estate sales were down 13 percent from their peak levels in October 2020. Much of this is due to the lack of housing inventory and rising real estate prices. The good news is that housing starts continue to be strong, which should help to alleviate housing supply pressures over the longer term.
The Bad News
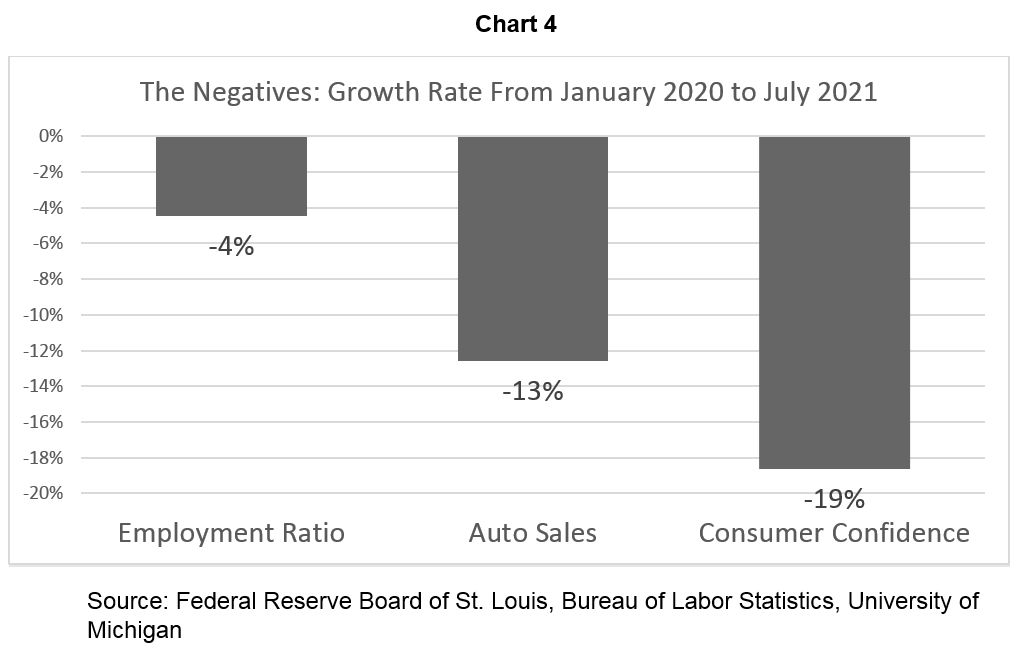
But amid this positive news there are also negative results. Chart 4 illustrates three areas where we still have not seen recovery back to prepandemic levels. Employment levels – the percentage of the adult population that is employed – remain 4 percent below prepandemic levels. Auto sales remain 13 percent below prepandemic levels. And most interestingly, consumer confidence remains 19 percent lower than before COVID-19.

Let’s examine each of these areas in a little more depth. If you travel almost anywhere in the U.S., the ubiquitous nature of “Help Wanted” signs can’t be missed. So why is the overall employment ratio 4 percent below prepandemic levels? If we look one level deeper, we see an issue that is beginning to plague the workforce and our industry.
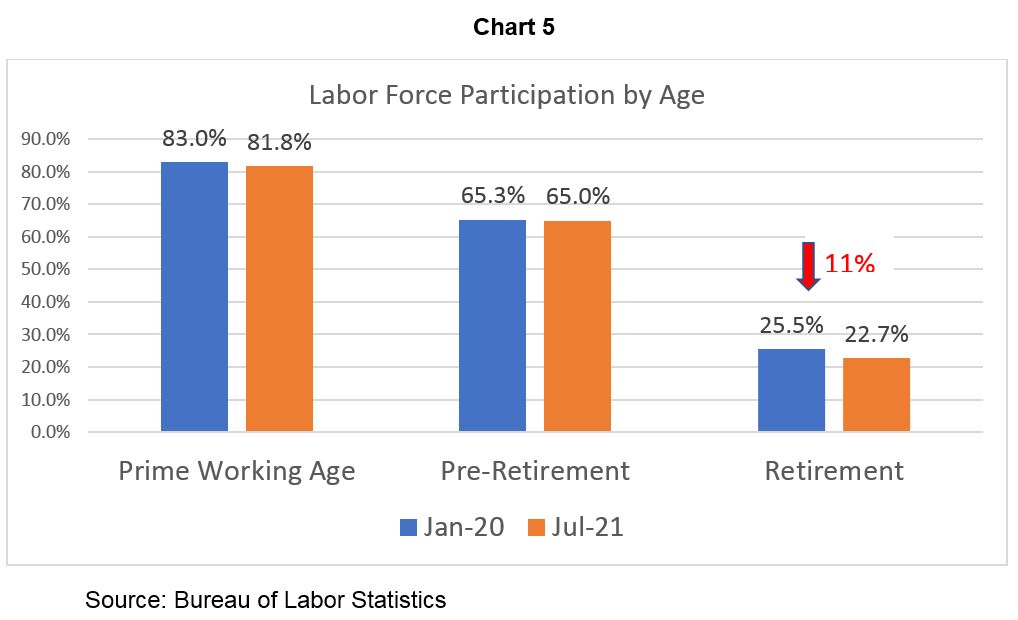
Chart 5 illustrates the change in the labor force participation rate by age group. Broadly, we examine three groups: prime working age (25 to 54 years), pre-retirement (55 to 64 years) and retirement (65 years or older).

What the data illustrates is that labor force participation – the percentage of the population that is either employed or looking for work – has almost fully recovered for both the prime working age group and the pre-retirement group. However, the percentage of those over the age of 65 who have left the workforce is down by 11 percent between January 2020 and July 2021. It’s as if this older group has decided that enough is enough and left the workforce.
This has huge implications for the economy and our own staffing concerns. In many cases, we are losing our most experienced people and having to quickly replace them with workers who don’t have the same level of knowledge or even ability. It will also have the longer-term impact of driving up the cost of employment. And it will increase the importance of trends such as workplace automation, AI chatbots and more. Perhaps the biggest impact will be on corporate culture, as many of these individuals played an essential role in establishing and maintaining the culture within our organizations.
Auto sales and Chart 4 also present an interesting challenge. As recently as April of this year, auto sales were 8 percent above prepandemic levels. Now they are 13 percent lower than before COVID-19. This is the interesting conundrum caused by supply chain issues. There still is a willingness to buy cars, but the supply is lagging and causing economic disruption. Our long-term concern regarding vehicle sales is that we don’t expect that the growth in auto sales will match the growth rate of individuals or households as transportation needs evolve. In fact, it has not, as Chart 6 illustrates. While auto sales are significantly impacted by economic conditions, the long-term trend in auto sales is positive. In contrast, if auto sales are measured per million adults, the trend line is negative.

The final item on Chart 4 is consumer confidence. This measure is almost 20 percent lower than it was before COVID-19. The continuing concerns about new virus variants have undoubtedly contributed to these low levels of confidence. Uncertainty breeds concern, and this concern is likely to influence consumer sentiment and behavior far into the future.
The implications of this are also clear. The Federal Reserve has been extraordinarily accommodative in monetary policy, with the result that interest rates have been historically low. With the current level of consumer concerns, don’t expect Fed policies to change in significant ways soon. We will be operating in a low-rate environment into 2022, with its resulting negative impact on net interest margins and earnings.
The Long-Term View
As we have repeatedly noted over the past 18 months, COVID-19 has served more as an accelerant of trends rather than a creator of new trends. Our view on this has not changed and is strengthened by the data. Here are the things your organization needs to keep squarely in focus as you move into planning season:
- The transformation of the delivery ecosystem – This is both the continued evolution of the branch network and improved digital tools that allow you to compete with the big banks, who are winning the battle for the younger generations
- Financial wellness – Increased consumer uncertainty put financial wellness more squarely in the spotlight for many consumers. Financial wellness should be part of your brand value
- Corporate culture – Many organizations are losing key people either to retirement or to other competitors and industries. Your culture will be key to your retention of the people who matter most, as well as your ability to attract top new talent
- Efficiency – At the same time, it is critical to find ways to do things more effectively, both in order to make things simpler and easier for the customer or member, as well as to reduce the staffing requirements at your organization. Workplace automation and tools such as IA chatbots should be part of your future
- Earnings – Low net interest margins will continue to place pressure on your organization. Find new income sources that move beyond the traditional items, as well as build deeper relationships within the customer or member base. Higher balances per household clearly correlate with greater organizational efficiency

Want to ask us a question?
Interested in our services?
We’re here to help.
2900 Westside Parkway
Alpharetta, GA 30004
© 2025 Fiserv, Inc., or its affiliates.